Chart represents the trade activities between Indonesia and the UK
Cost recovery component in billion USD.
The chart illustrates the sales (in volume) of each oil fuel product in Indonesia.
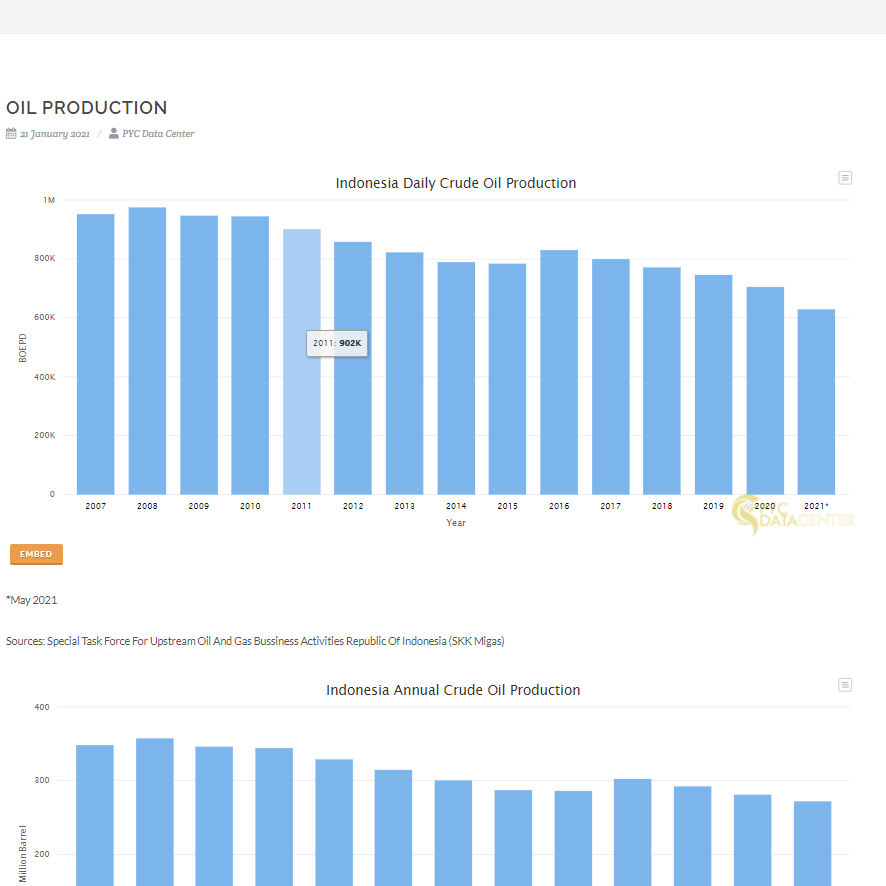
The charts illustrate the crude oil production in Indonesia.
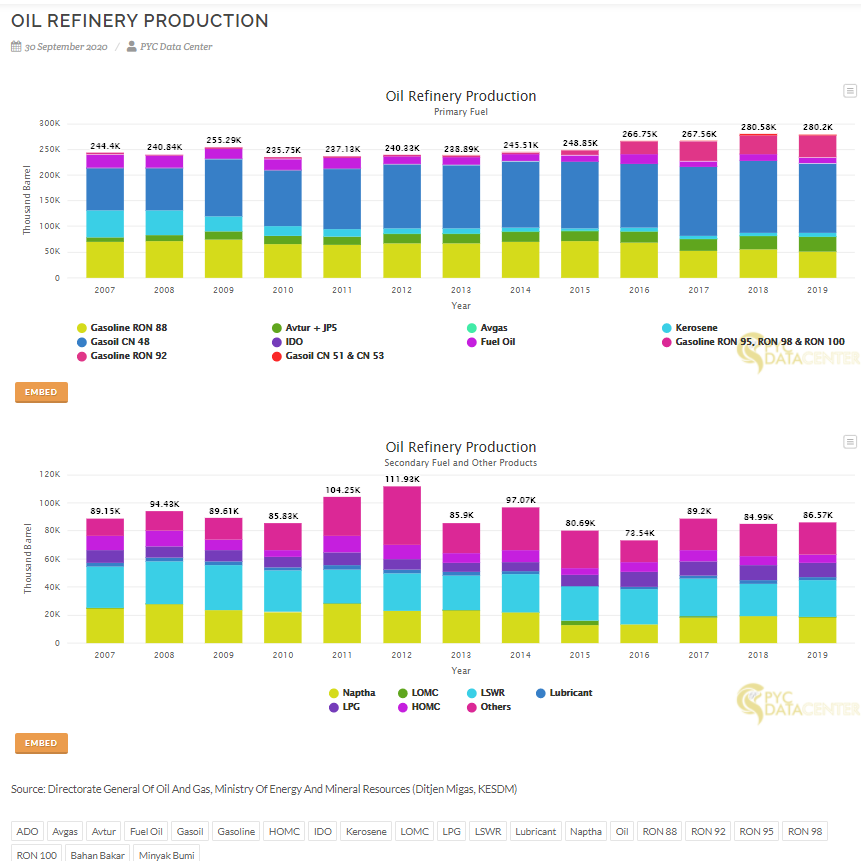
The charts illustrate the annual oil refinery product, including primary fuel, secondary fuel and other products.


