The charts illustrate the amount of fuel consumption of the PLN power plant by the source in the original unit.
The charts illustrate the gross and net volume of natural gas production in Indonesia, as well as its source type (associated and non-associated).
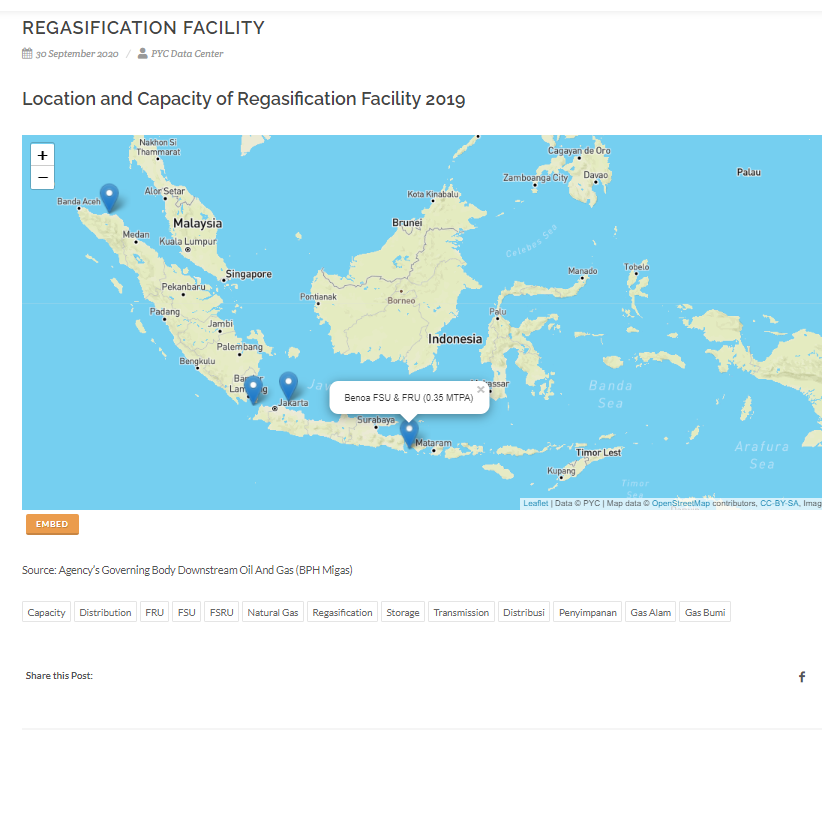
The map illustrates the location of floating storage regasification unit (FSRU) and its capacity in Indonesia.
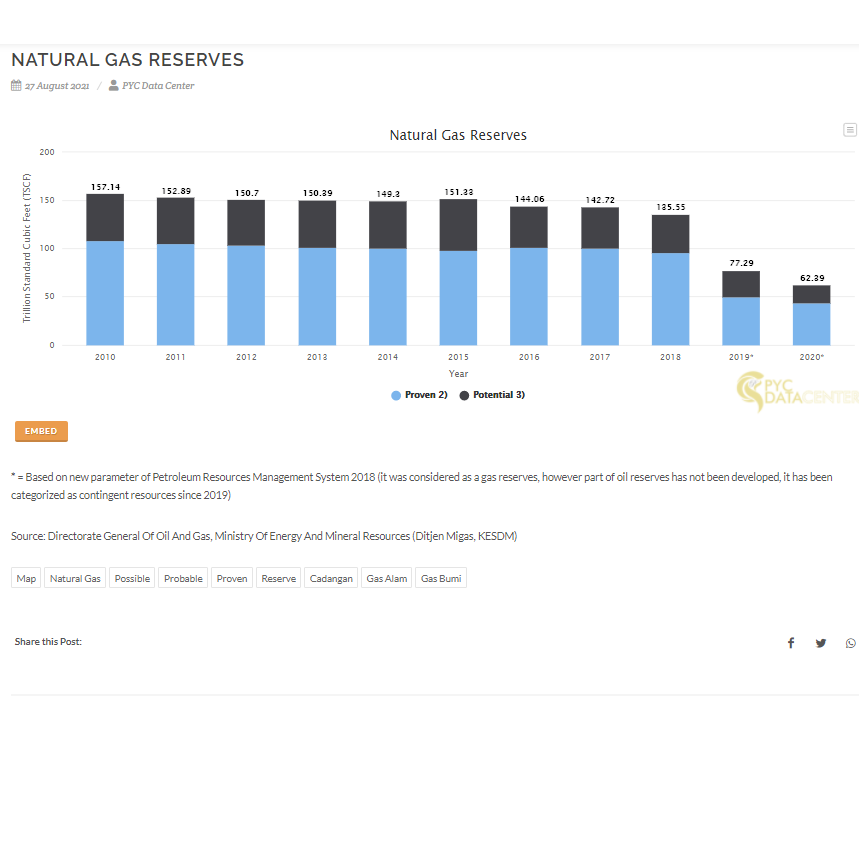
The chart illustrate the amount of natural gas reserves in Indonesia.
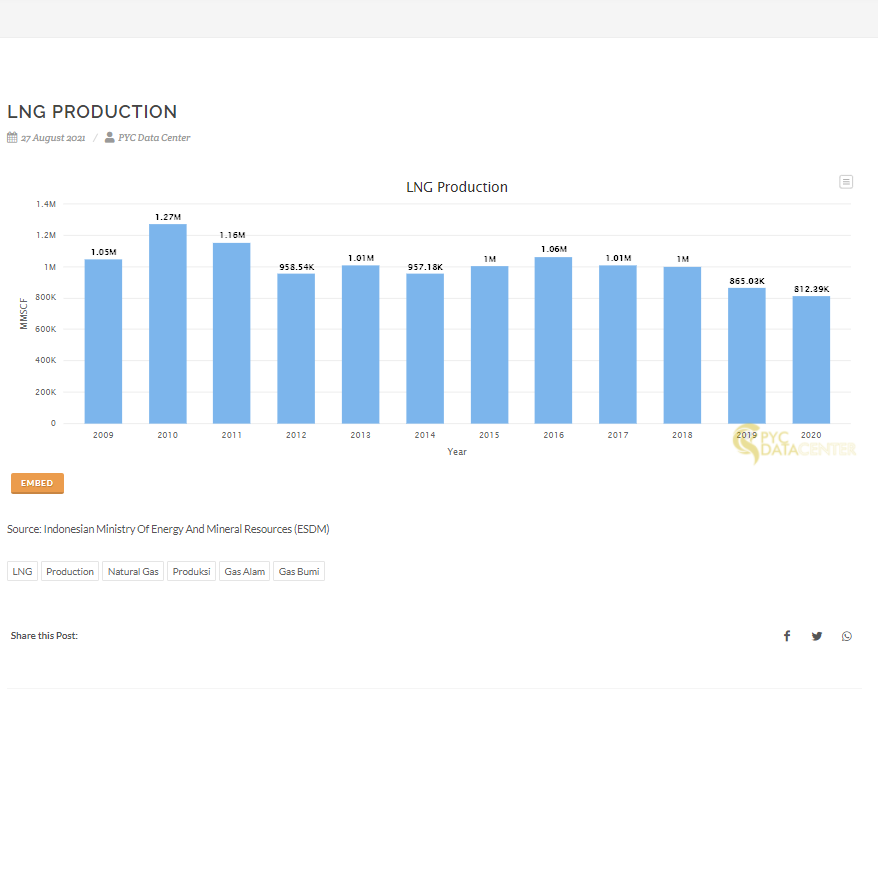
The chart illustrates the volume of annual LNG production in Indonesia.


