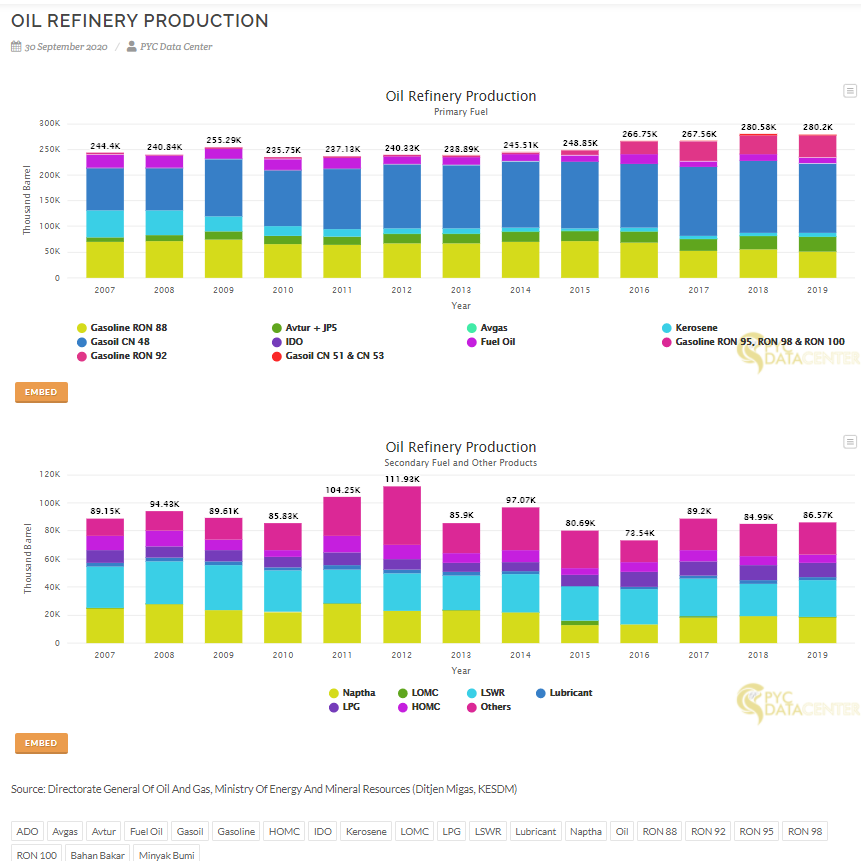
The charts illustrate the annual oil refinery product, including primary fuel, secondary fuel and other products.
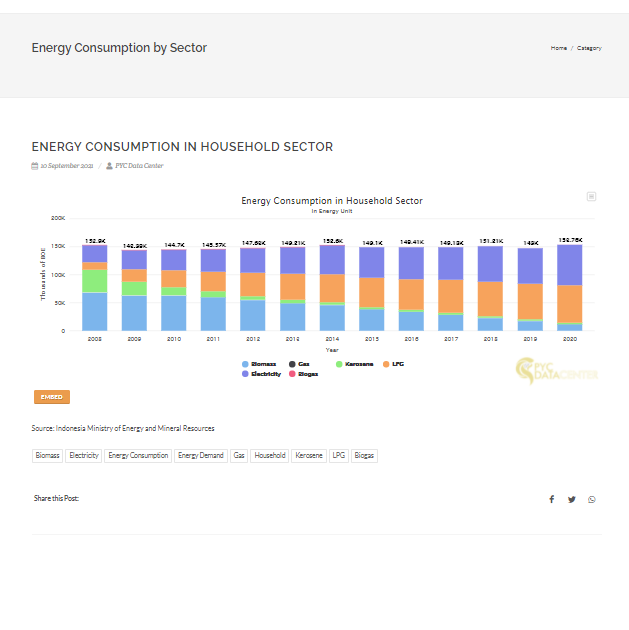
Charts illustrate the comparison from each energy type in household sector, both in energy and original unit.
Charts illustrate the comparison from each energy type in commercial sector, both in energy and original unit.
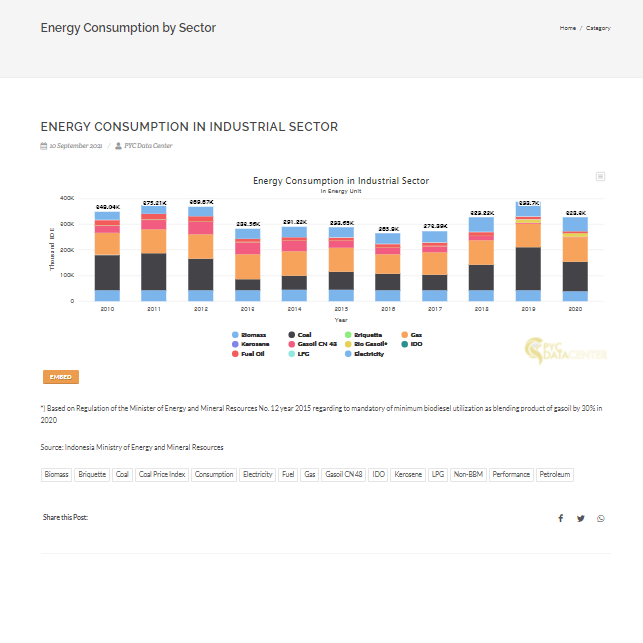
These charts illustrate the energy used by the industrial sector with their specific original unit.
The map and charts illustrate the capacity of LPG production from the domestic refineries in Indonesia.


