The charts illustrate PLN's electricity system performance including average thermal efficiency, capacity factor, load factor, peak load, and network losses.
The map illustrates the location and capacity of LNG refineries in Indonesia.
The map and chart illustrate the capacity of each oil refinery in Indonesia.
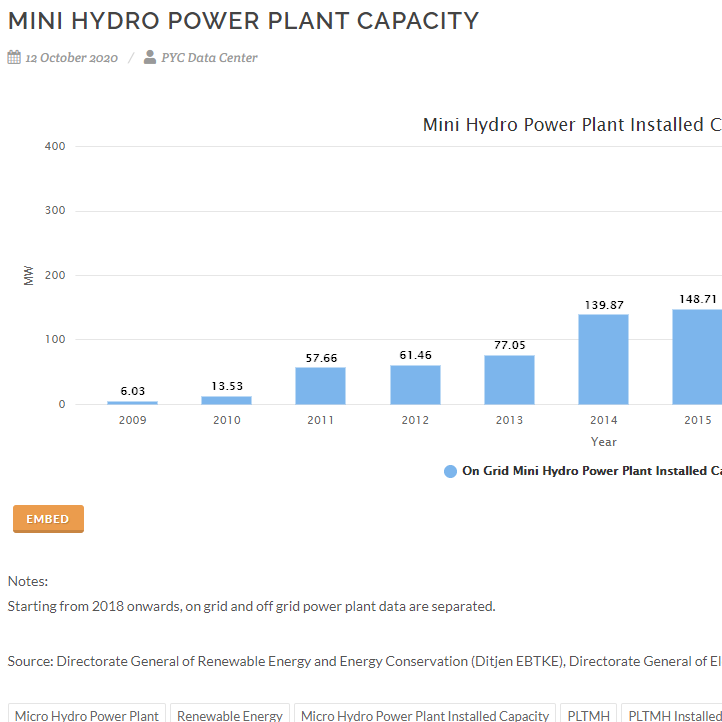
The chart illustrates Indonesia's total mini hydro power plant installed capacity.
The maps illustrate Bioenergy Capacity in Indonesia.


