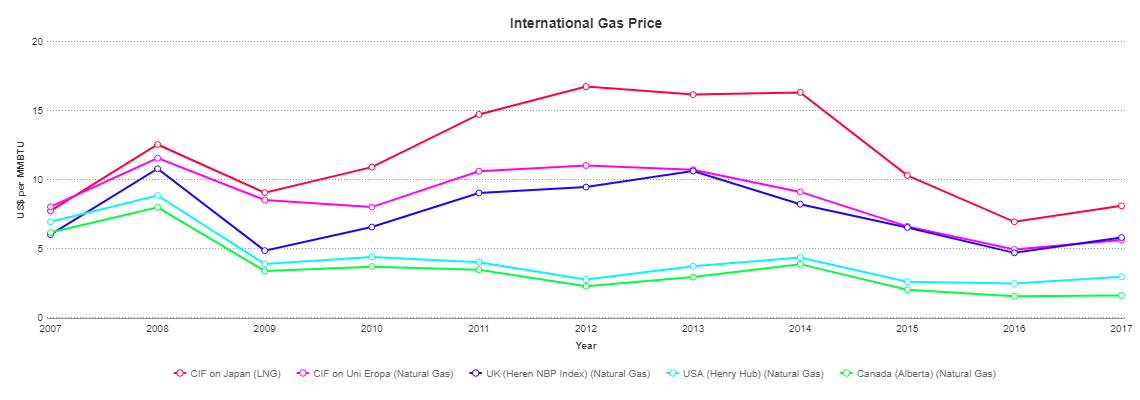
Chart illustrates international price of natural gas.
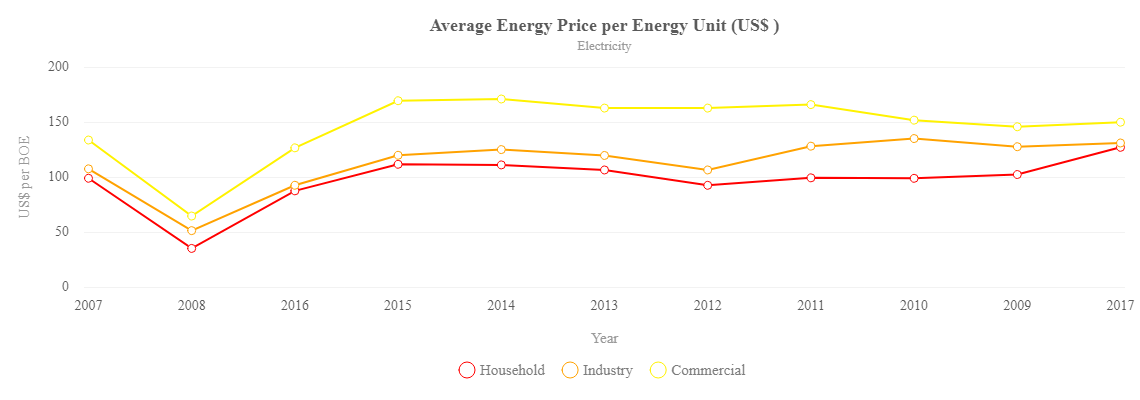
Charts illustrate the average energy price per energy unit, classified in two categories: oil, gas and coal and electricity.
The charts illustrate the gross and net volume of natural gas production in Indonesia, as well as its source type (associated and non-associated).
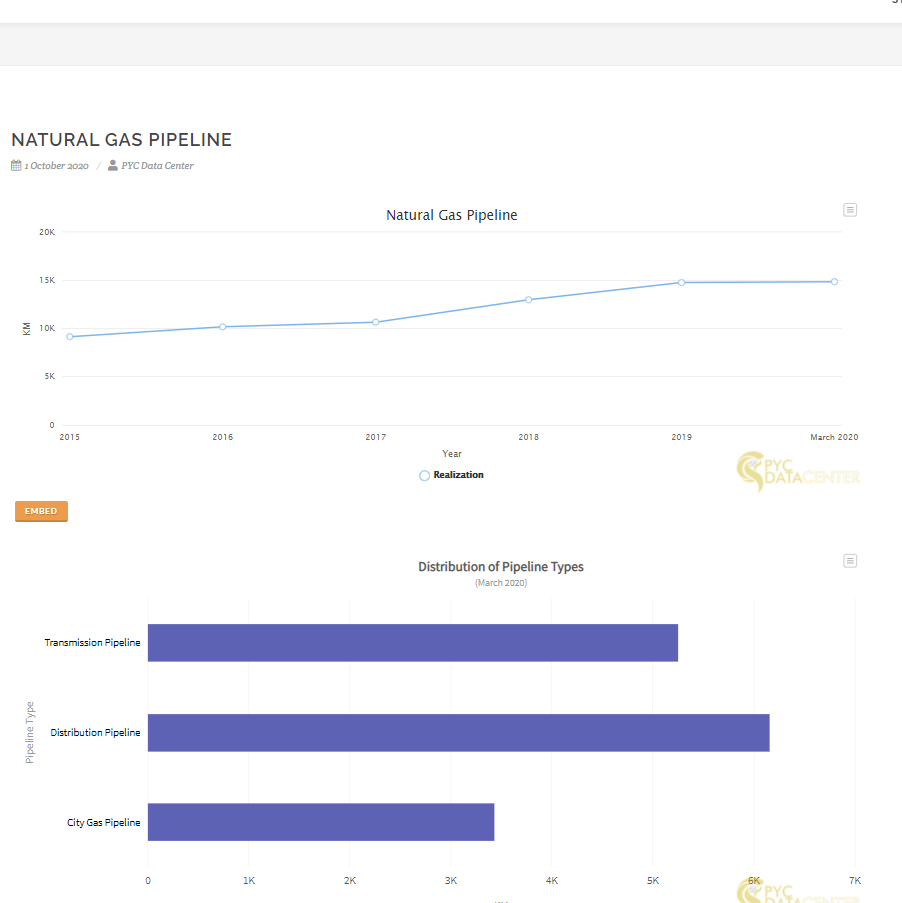
The charts illustrate the realization of natural gas pipeline development in Indonesia. The natural gas pipeline including the transmission and distribution pipeline.
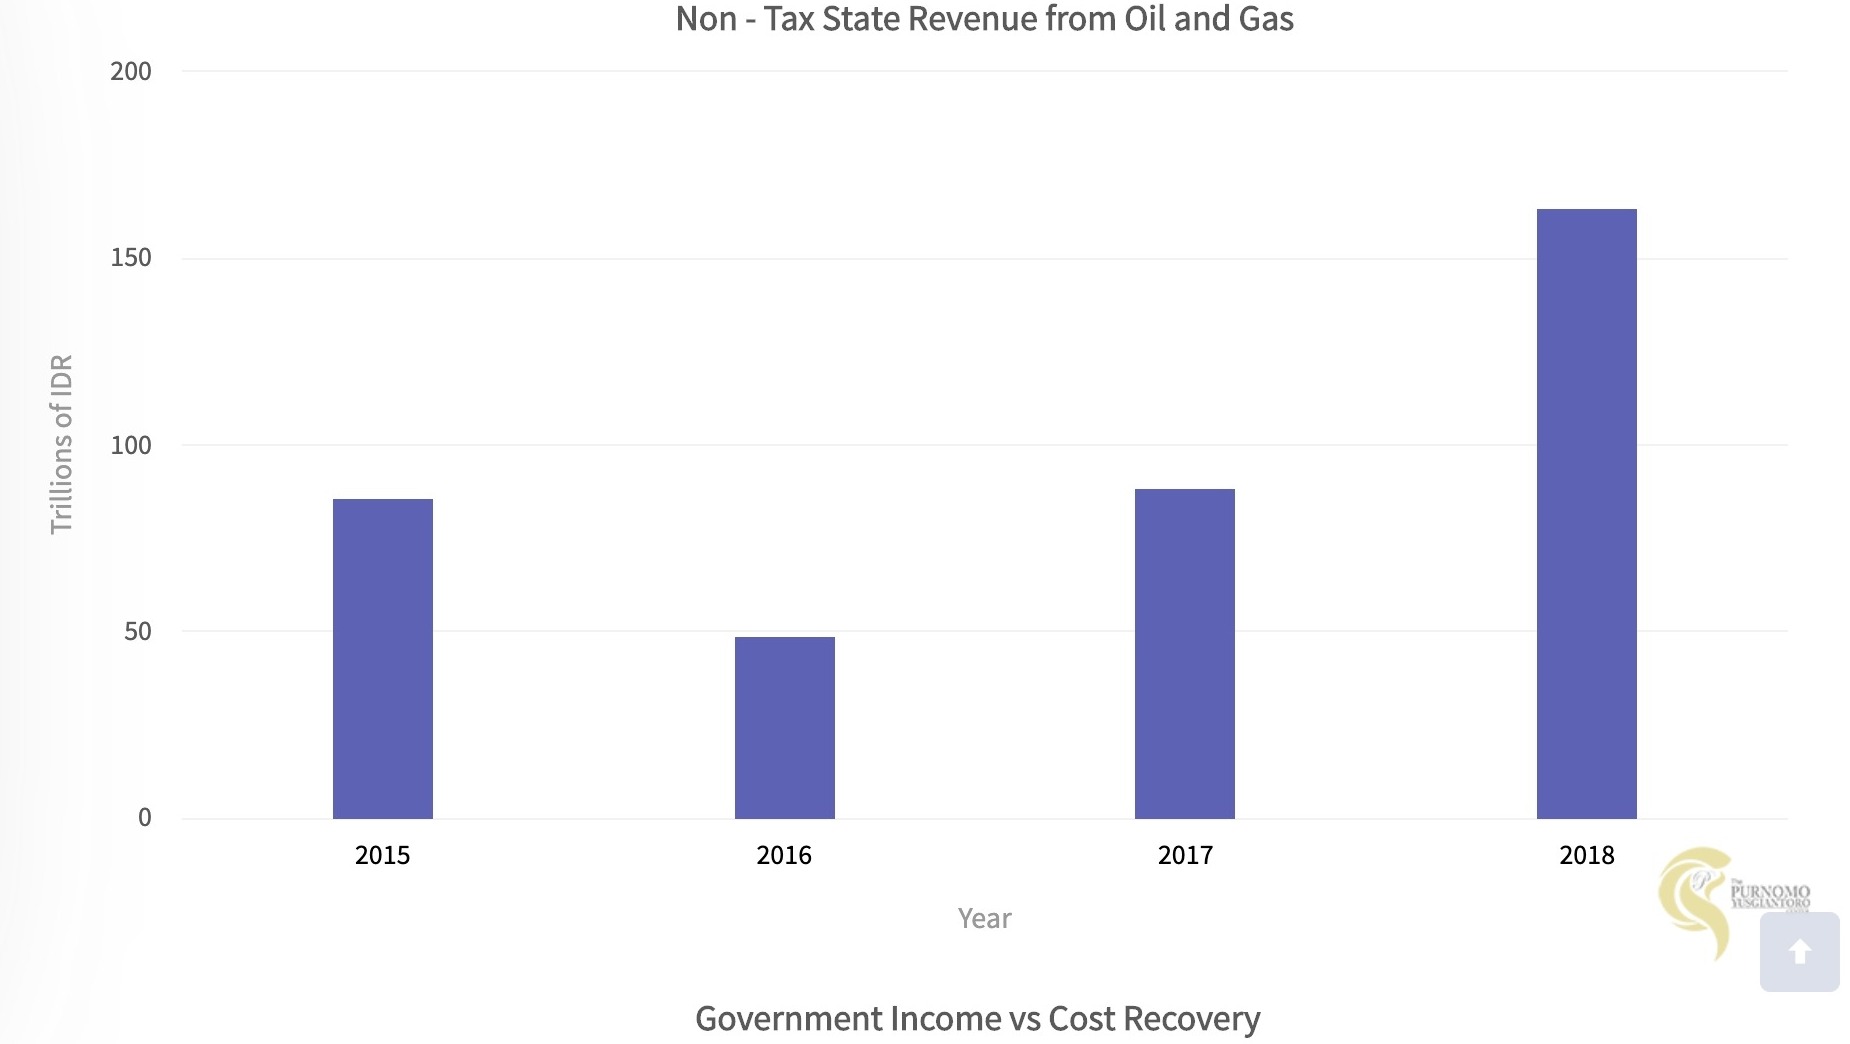
Charts illustrate the value and composition of non-tax revenues in the upstream oil and gas industry.


