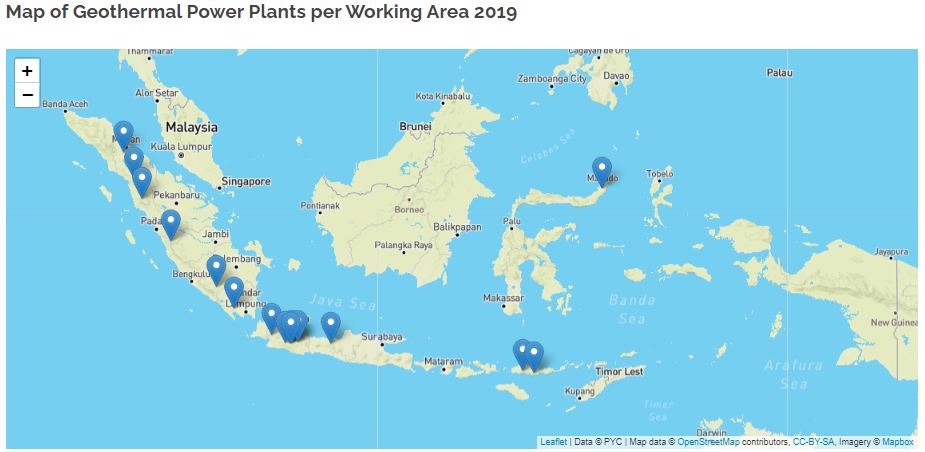
The map and chart illustrate Indonesia's total geothermal power plant capacity.
Chart illustrates the price index for electricity.
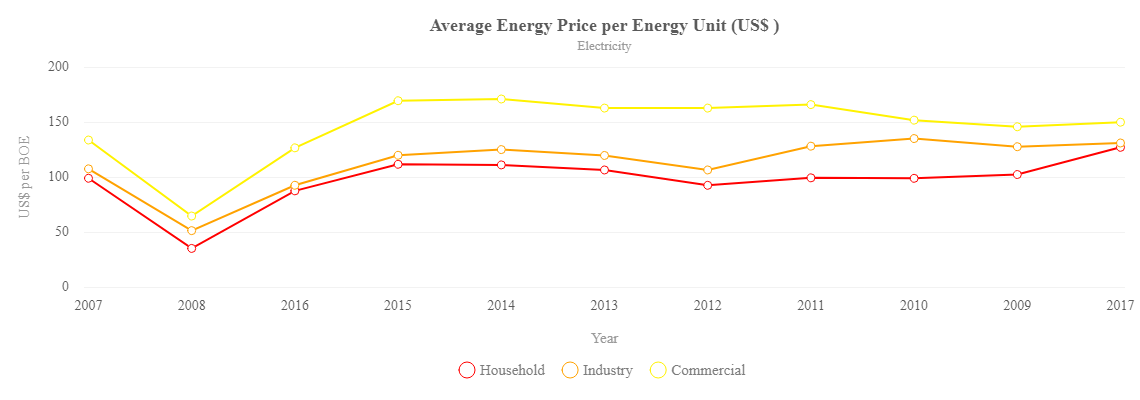
Charts illustrate the average energy price per energy unit, classified in two categories: oil, gas and coal and electricity.
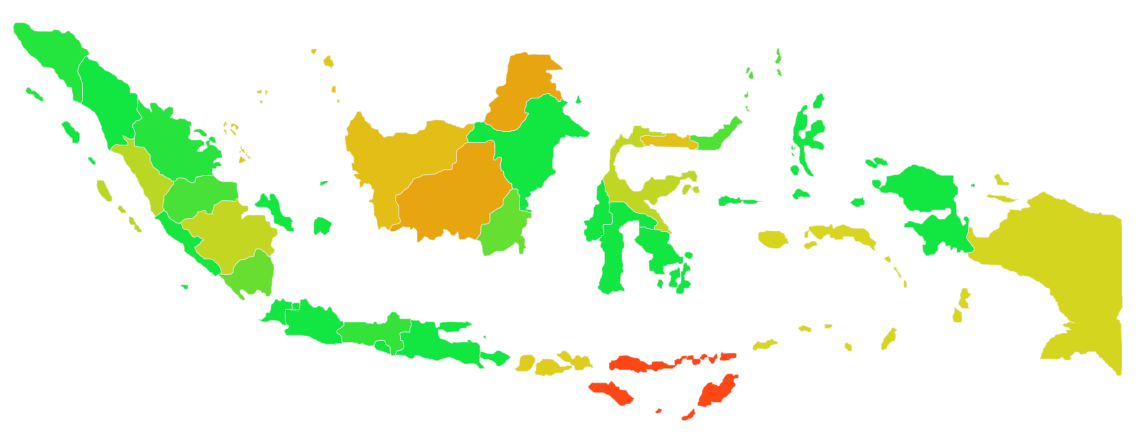
The map and chart illustrate the electrification ratio at the national and regional levels.
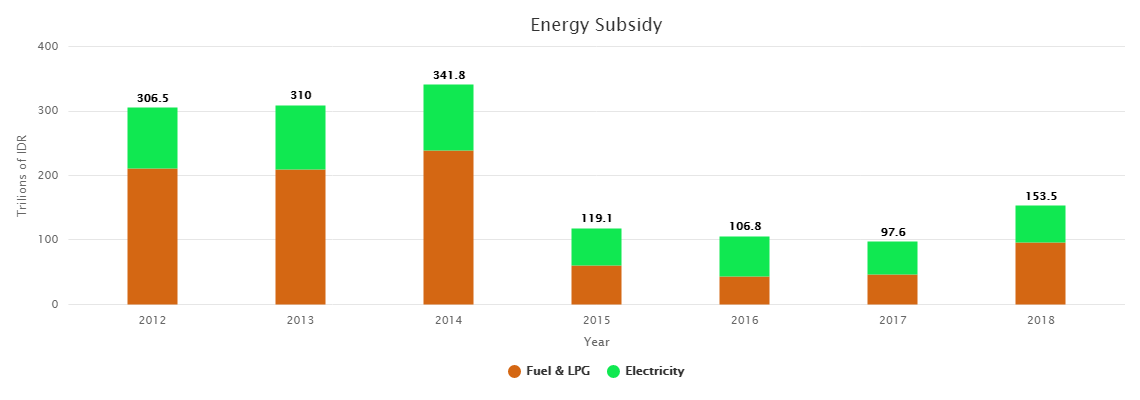
Chart illustrates the value of government subsidy in domestic fuel oil and LPG, and electricity.


