The charts illustrate PLN's electricity system performance including average thermal efficiency, capacity factor, load factor, peak load, and network losses.
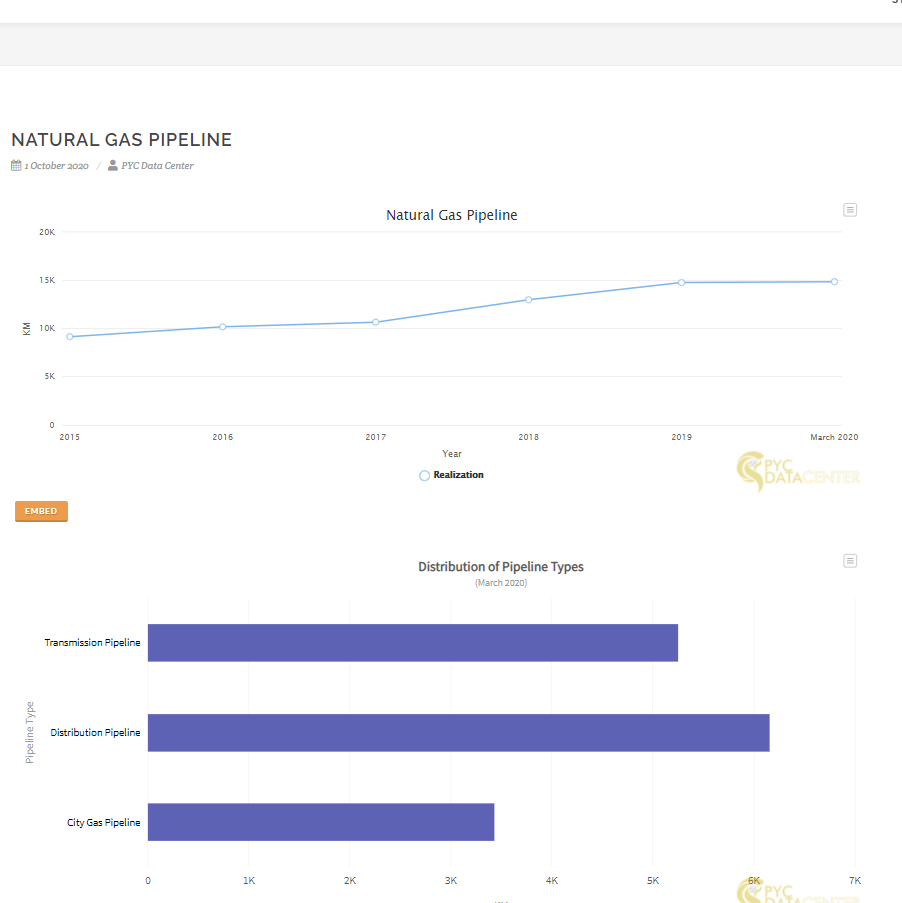
The charts illustrate the realization of natural gas pipeline development in Indonesia. The natural gas pipeline including the transmission and distribution pipeline.
The map illustrates the location and capacity of LNG refineries in Indonesia.
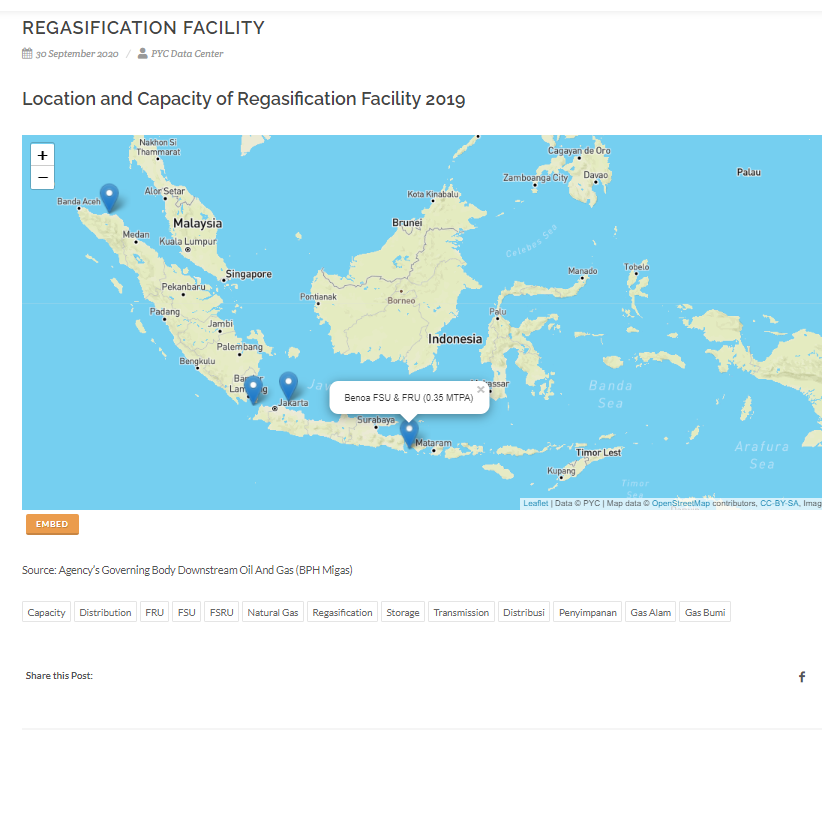
The map illustrates the location of floating storage regasification unit (FSRU) and its capacity in Indonesia.
The chart illustrates the number of households connected to the city gas infrastructure in Indonesia


