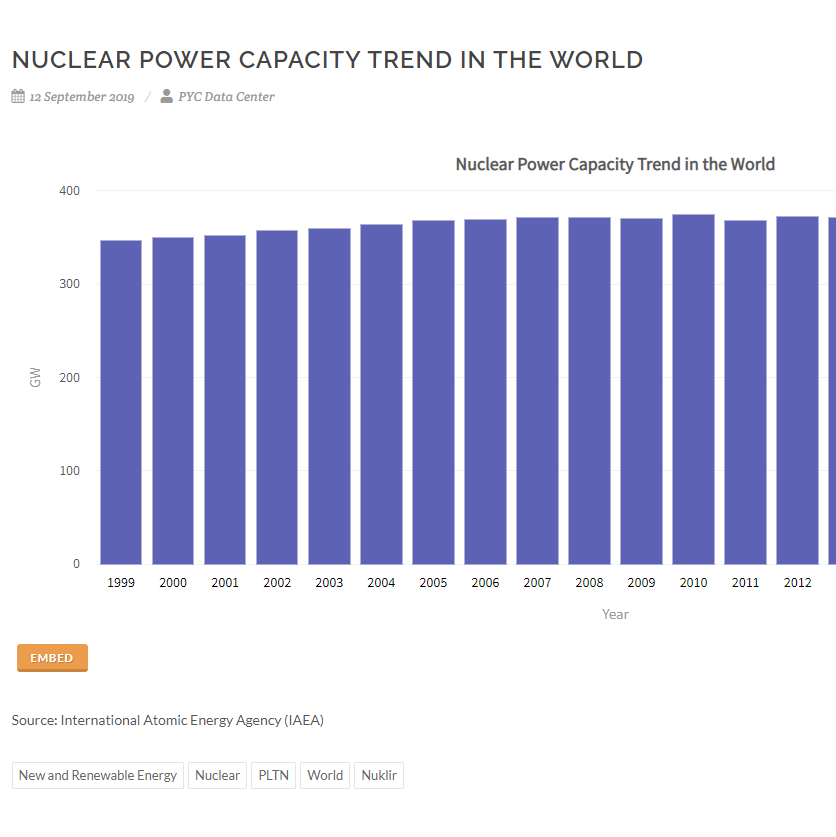
The chart illustrates nuclear power capacity trend in the world.
Updates
- 22 August 2024
- 20 August 2024
- 20 August 2024
- 29 July 2024
- 29 July 2024
- 15 January 2024
- 10 January 2024
- 9 January 2024
- 9 January 2024
- 9 January 2024
The chart illustrates nuclear power capacity trend in the world.
ProCache: v318 Render date: 2026-06-25 11:39:56 Page render time: 0.0400s Total w/ProCache: 0.0411s